I will give a presentation at the European Turbulence Conference about “Comprehensive open datasets of stratified turbulence forced in vertical vorticity or wave modes”. I will actually focus on results obtained from simulations forced with internal gravity waves.
The slides are available here .
Abstract of my presentation 
\(\newcommand{\R}{\mathcal{R}}
\newcommand{\epsK}{{\varepsilon_{\!\scriptscriptstyle K}}}
\newcommand{\epsA}{{\varepsilon_{\!\scriptscriptstyle A}}}
\newcommand{\kmax}{k_{\max}}\)
We present new comprehensive open datasets of stratified turbulence in a periodic
domain with constant Brunt-Väisälä frequency
\(N\)
. The forcing is either in large
horizontal vortices or in wave modes. More than 80 simulations were carried out
with the
ns3d.strat
pseudo-spectral solver of the open-source CFD framework
Fluidsim.
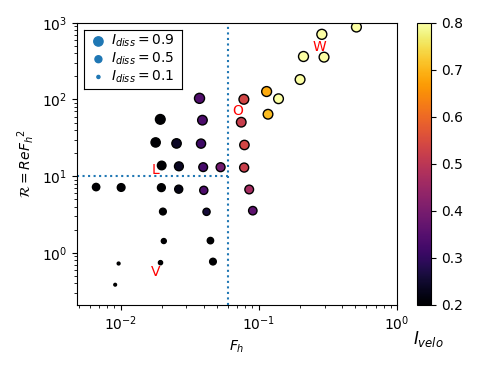
This datasets have 3 main particularities. (i) The horizontally invariant shear modes are cleanly removed from the dynamics. (ii) Large ranges of horizontal Froude \(F_h = \epsK /(N U_h^2) \in [0.007, 2]\) and buoyancy Reynolds \(\R = Re {F_h}^2 = \epsK / (\nu N^2)\) numbers are investigated, with \(U_h\) the horizontal rms velocity, \(\epsK\) the kinetic energy dissipation rate, and \(\nu\) the viscosity. These datasets are adapted to investigate the different regimes of stratified flows forced with vortices, in particular the weakly stratified regime ( \(F_h > 0.1\) ) and the Layered Anisotropic Stratified Turbulence regime (LAST, \(F_h < 0.07\) and \(\R > 10\) ).
|
|
(iii) Statistical quantities like (1) spatial, temporal and spatio-temporal spectra and (2) spectral energy budget are provided. We will show how it will be easy for anyone to investigate stratified turbulence with this dataset by loading and plotting these quantities with our Python library Fluidsim.
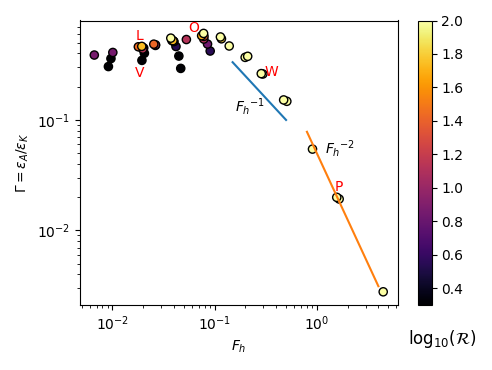
Different physical questions will be addressed in view of numerous geophysical applications. (i) Characterization of the different regimes (left figure), in particular through comparisons based on spatial and temporal spectra with theoretical results and in-situ measurements. (ii) Scaling laws for different averaged quantities like the mixing coefficient \(\Gamma=\epsA/\epsK\) (right figure), where \(\epsA\) is the potential energy dissipation rate. (iii) Presence and degree of nonlinearity of internal gravity waves through a spatio-temporal analysis.